 The school was scheduled to be closed down. The children were unhappy, the parents were unhappy; the outlook was grim. The reason given for the imminent closure: not enough pupils from the immediate area to justify its staying open. And that is when a hefty piece of modern technology stepped in.
It did not take long for GIS to establish the fact that there actually WERE enough youngsters of school age living nearby to warrant a learning institution in their neighborhood. And the school remained open.
GIS via MapInfo saved the day. It showed the names and ages of the pupils as well as which part of the city they inhabited. (Jerusalem has a zoning restriction for schooling.) The same system is also being used to decide where a new school is to be built.
“We studied other GIS’s in Israel and abroad and also learned from others’ mistakes,” says Menachem Helman, head of the Jerusalem Municipality’s GIS Centre. “We wanted to make sure that our objectives described the needs of the municipality and not necessarily those of the GIS – thus ensuring that the GIS actually serve the municipality and not the other way around.
“What we are aiming at is to have common databases connect various planning and implementation bodies for the creation and synchronization of work plans and facilities. Moreover, all the planners in the city can avail themselves of information about existing and planned procedures in any given area. We want to be a true client-server, both in database and application design.”
“So now we are here to offer the tools,” Helman says. “Decision-makers at all levels, on the basis of trusted spatial information and tools, then use these to create facts on the ground.”
“GIS offers the motivation for creative thinking,” adds Yoni Bar-Lavie, Chief Programmer. He explains that the Jerusalem GIS Centre operates simultaneously along two parallel lines: the strategic line defines the long-term vision for the municipality, and the functional line attends to immediate needs, such as, for instance, the matter of schools.
Recently, a precedent-setting case involved a lawyer who sued the city for a large sum because he was disturbed by noise from a place of entertainment located several kilometers away from his home. The law stipulates that noise constitutes a disturbance when it arrives “as the crow flies” – in direct vision line. Via GIS it was proven that between the lawyer’s home and the site from which the noise emanated, there was no direct eye connection. Interestingly, this was in effect the first time such proof was brought to a court and was accepted by it as valid evidence.
In Jerusalem, being the capital of Israel, there are frequent official visits and special events. Convoy routes must be marked and eventual emergency services organized. Also, events such as marches and marathons all come within the purview of municipality logistics planning, and this type of planning points to the GIS Centre.
Via photogrammetric material, the department receives data indicating roads, hills and valleys, buildings, greenery, even fences and electric poles. These are then divided into 500m x 400m squares. To update maps of this rapidly-growing city, aerial pictures are used, with new layers placed on the old maps. The Centre is conducting a 5-year project of creating infrastructure databases with the country’s electric and telephone companies.
According to need, the GIS Centre, consisting of 11 people, makes use of tools such as MapInfo, MapBase, ArcInfo, AutoCAD, IBM mainframe and Microsoft NT server. None of the data obtained via these is ever deleted, all is saved and in use. The same information, Bar-Lavie says, goes into many directions. Thus, for example, the same data conceived to enable firefighting vehicles to enter narrow (less than 4m wide) streets, can also serve for the planning of transportation in connection with the annual autumn marches through the city’s streets.
 When it comes to marathons – an annual event in almost every one of the big cities in Israel, the story is somewhat different. In Jerusalem, there are three different marathons: the half marathon – 21 kms, a middle-sized one – 10 kms, and the third, meant for children and older folk, of 4.2 kms. (One couple – an 83-year-old man and his 78-year-old wife participated in the last 21 km marathon this spring. The mayor of Jerusalem, too, is one of the runners.) While the basic map is the same for all – with streets big and small, the markings of both the names of streets and those of neighborhoods – three different routes are marked for the three types of marathon, each appearing in a different color. The tool used is AutoCAD 2000.
Jerusalem, a hilly city spread over some 128 square kms, and home to about 650,000 inhabitants, has some 2000 accidents a year. Rolling up its virtual sleeves, the GIS Centre, in addition to documenting the details of the accidents, tries to discover the causes.
Thus, it was found that the intersection of Ben Zvi Avenue and Ramban Street in a residential district of Jerusalem was the scene of too many accidents. MapInfo got to work to ascertain the common denominator of these accidents. And found it: the night lighting was simply insufficient. The situation was ameliorated when the lighting was adjusted.
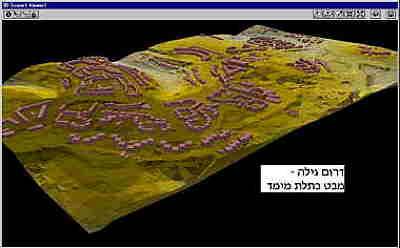
 In another area, near the southern neighborhood of Gilo, the angle of the sun in relation to the traffic control light hampered light visibility at sunset. Again, it was GIS analysis that discovered this. To amend the situation, black screens were placed in back of the traffic light – and the cause of accidents was thus reduced.
Within a radius of 10 meters from a school, it was found that too many pedestrians – often children – were hit by passing cars. As a result of GIS investigation, the fault was found and corrected: new elevated slow-down strips were built into the street and pedestrian crossings were raised.
At still another intersection, a problem was found and solved by extending the time of the intermediary orange light on the traffic light from 1 and a half to 2 and a half seconds.
“It’s a kind of cat and mouse game,” says Kobi Mamalia, director of the municipality’s traffic information department, which makes frequent use of the data made available by the GIS Centre. “As soon as we see a problem, we get there with our ‘detective technology’ to discover the cause and then proceed to solve it.”
 Strange as it may sound to some who may associate Israel’s climate with being basically subtropical, the city of Jerusalem makes preparations each year for clearing streets from snow. Once every two years, there is, in effect, in this city which is some 850m high, one or two days of heavy snow. The GIS staff prepares some 100 copies of the map in which priority roads are marked in red, secondary roads in blue. Pinpointed on these are the various districts, fire, bus and first aid stations, and the electric and telephone company headquarters.
“GIS is a field that encompasses many disciplines”, states Helman. “But the leading discipline for the GIS is data automation. Our Centre is small but very active. It manages many projects, vast mapping operations, synchronizes different extra-municipal activities and supplies GIS support for decision-making on relevant issues.”
Thus, Jerusalem GIS Centre tackles many and varied problems and is always on the spot when needed.


